Wednesday, December 18, 2024

Tuesday, December 17, 2024

Monday, December 16, 2024


Amazon Advertising Sponsored Products Campaign Report

If you’re selling products on Amazon and running ads, you’re probably familiar with the importance of tracking and optimizing your ad performance. But how can you know if your efforts are paying off? That’s where the Amazon Advertising Sponsored Product Campaign Report comes in.
Whether new to Amazon advertising or looking to sharpen your strategy, understanding these reports can make a huge difference in maximizing your ad spending and growing your business.
Understanding the Campaign Report for Sponsored Products
The Campaign Report for Sponsored Products is a comprehensive tool designed to show how well your ads perform over a specified period. You can use it to evaluate everything from daily performance to monthly trends, allowing you to make informed decisions on improving your campaigns.
This report summarizes the performance of your Sponsored Products ads across different campaigns. It tracks crucial metrics and helps you analyze the effectiveness of your ad strategies. You can use it to:
- Track your ad spend
- See how many impressions (views) your ads are getting
- Measure how often people are clicking on your ads
- Evaluate how much revenue your ads are generating
In short, the Campaign Report is your one-stop shop for tracking how well your ads are doing and what changes need to be made.
Types of Data Available in the Report
The Sponsored Product campaign report offers a variety of data types that can be helpful depending on how deep you want to dive into your ad performance. When you drill down into your report, you’ll see a variety of metrics that give a complete view of your campaign’s performance. Key metrics include:
- Impressions: Understanding impressions can help you gauge the reach of your ads. If your impressions are low, it might indicate that your ads aren’t being shown to enough people.
- Clicks: Clicks are a critical metric. A high click-through rate (CTR) generally means your ad appeals to customers. If clicks are low, your ad needs better call-to-action or more engaging visuals.
- Spend: This metric shows how much money you’ve invested in the campaign. Tracking spend is essential for understanding whether you’re getting a good return on your investment.
- Sales: Sales data is crucial in determining the effectiveness of your ads. If you get lots of clicks but low sales, your landing pages or product listings may need improvement.
- ACoS and RoAS: These two metrics go hand-in-hand. A low ACoS means you’re spending less on ads than the sales generated, while a high ROAS shows that your advertising dollars are being used effectively.
Here is the list of the base metrics:
- Impressions
- addToList
- qualifiedBorrows
- royaltyQualifiedBorrows
- Clicks
- Cost
- Purchases (1 day)
- Purchases (7 days)
- Purchases (14 days)
- Purchases (30 days)
- Purchases (Same SKU, 1 day)
- Purchases (Same SKU, 7 days)
- Purchases (Same SKU, 14 days)
- Purchases (Same SKU, 30 days)
- Units Sold (Clicks, 1 day)
- Units Sold (Clicks, 7 days)
- Units Sold (Clicks, 14 days)
- Units Sold (Clicks, 30 days)
- Sales (1 day)
- Sales (7 days)
- Sales (14 days)
- Sales (30 days)
- Attributed Sales (Same SKU, 1 day)
- Attributed Sales (Same SKU, 7 days)
- Attributed Sales (Same SKU, 14 days)
- Attributed Sales (Same SKU, 30 days)
- Units Sold (Same SKU, 1 day)
- Units Sold (Same SKU, 7 days)
- Units Sold (Same SKU, 14 days)
- Units Sold (Same SKU, 30 days)
- Kindle Edition Normalized Pages Read (14 days)
- Kindle Edition Normalized Pages Royalties (14 days)
- Date
- Start Date
- End Date
- Campaign Bidding Strategy
- Cost Per Click
- Click Through Rate
- Spend
If you want a real-time AI-driven Amazon Advertising data copilot, the Openbridge AI Data Copilot can get you there fast:
How to Use Campaign Reports to Optimize Ad Performance
As you continue using these reports, remember that consistent analysis and optimization are the keys to success. Regularly review your campaigns, make necessary changes, and continue testing new strategies. The more you engage with your campaign data, the better your results will be.
Identify High-Performing Campaigns
The first step is to identify which campaigns are doing well. Look for campaigns with high sales and a low ACoS. These campaigns are performing effectively, and consider increasing your budget for them or scaling your efforts.
Spotting Underperforming Campaigns
If some campaigns have high ACoS or low sales, it might be time to re-evaluate. Here’s what you can do to improve underperforming campaigns:
- Adjust your bids: If your ads aren’t getting enough impressions, you might need to increase your bid.
- Change your targeting: Try targeting different keywords or your product targeting to reach a more relevant audience.
- Update your ad copy: Sometimes, the wording or images in your ads might not resonate with customers. Test different versions to see what works best.
Adjusting Campaign Settings
Once you’ve reviewed your data, it’s time to make adjustments. Consider:
- Reallocating your budget: If a particular campaign performs well, consider increasing its budget while cutting back on less effective ones.
- Modifying your targeting: Targeting the right audience is key. Use your report data to see which keywords or products generate the best results and focus more on those.
- Optimizing your bidding strategy: If certain keywords are performing better than others, increase your bid for those keywords to ensure your ads get shown more often.
Getting Started with Amazon Ads Sponsored Products Data Automation
Ditch the messy, manual reporting for the Amazon Ads Sponsored Product Campaign Report. Automated data feeds guide data-driven decision-making to improve off-Amazon digital marketing campaigns. Leverage insights to refine strategies, allocate resources efficiently, and enhance customer engagement across all touchpoints.
Openbridge will unify and deliver performance data to leading data lakes or cloud warehouses like Redshift, Google BigQuery, Snowflake, Azure Data Lake, and Amazon Athena for an analytics-ready single source of truth to fuel informed decisions on brand building strategy, media, and customer demand for Amazon.
With your data unified, start to turbocharge reporting, analytics, and business intelligence tools like Google Data Studio, Tableau, Microsoft Power BI, Looker, Amazon QuickSight, SAP, Alteryx, dbt, Azure Data Factory, Qlik Sense, and many others.
— ->>> Get a 30-day free trial to begin your Sponsored Product Campaign Report automation journey.
Amazon Advertising Sponsored Products Campaign Report was originally published in Openbridge on Medium, where people are continuing the conversation by highlighting and responding to this story.
from Openbridge - Medium https://ift.tt/x2n7hdf
via Openbridge

Sunday, December 15, 2024


Saturday, December 14, 2024
Friday, December 13, 2024


Amazon Advertising Campaign Reports for Sponsored Brands

For Amazon Sellers and Vendors, the Amazon Advertising Campaign Report for Sponsored Brands is a vital tool that offers deep insights into campaign performance. By understanding and utilizing the wealth of information it provides, you can optimize your campaigns, improve ROI, and strategically grow your business.
Understanding the Amazon Advertising Sponsored Brand Campaign Report
The Amazon Advertising Sponsored Brand Campaign Report summarizes your campaign performance over a selected date range. It’s available for Amazon Sellers and Vendor Central retailers running Sponsored brand campaigns.
Key Features of the Campaign Report
By leveraging this report, you can gain valuable insights into your campaigns’ performance and make informed decisions to enhance your advertising efforts. The report offers an aggregated overview of your campaign performance.
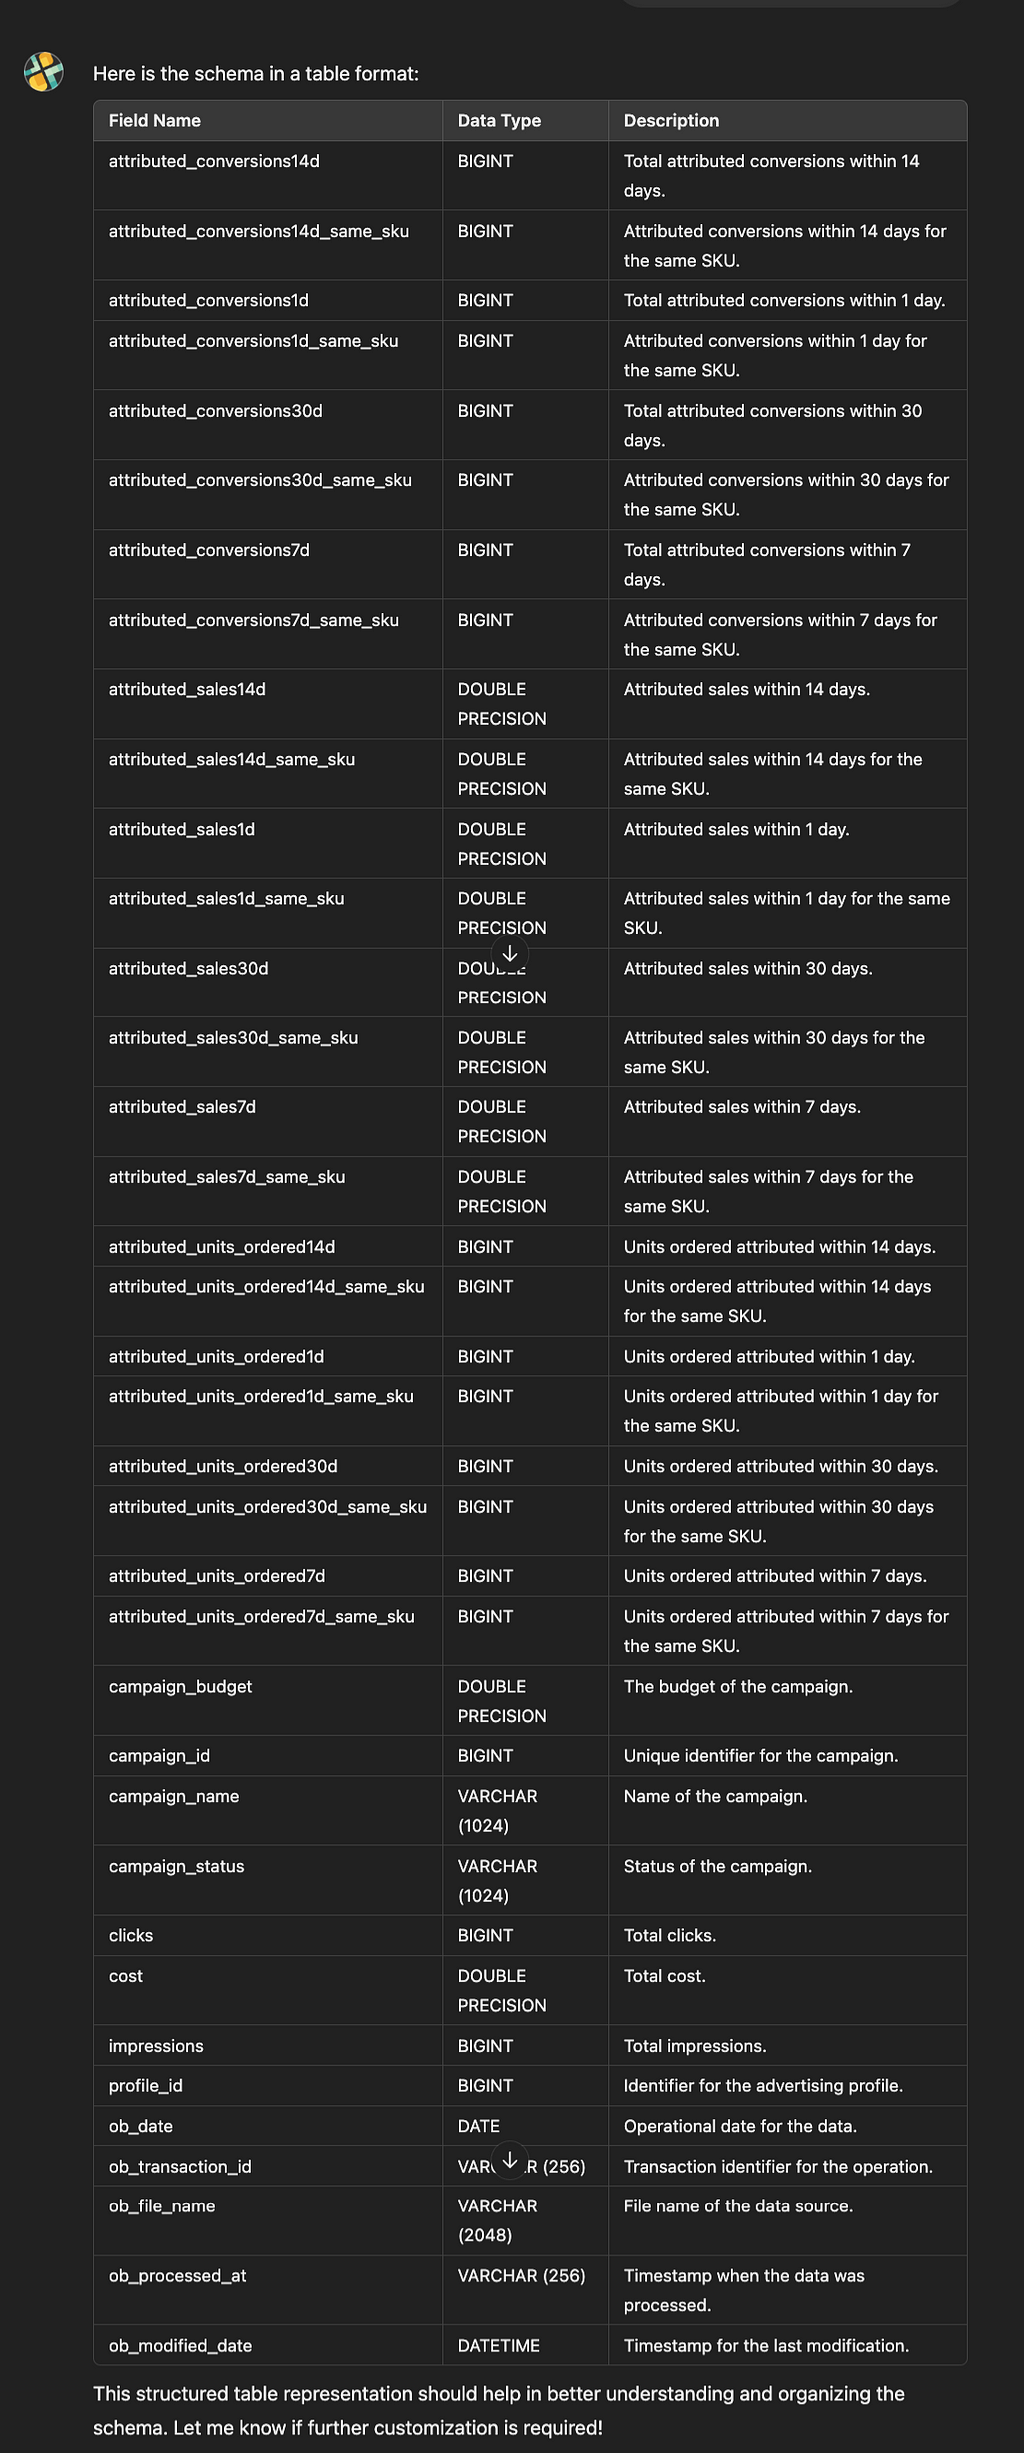
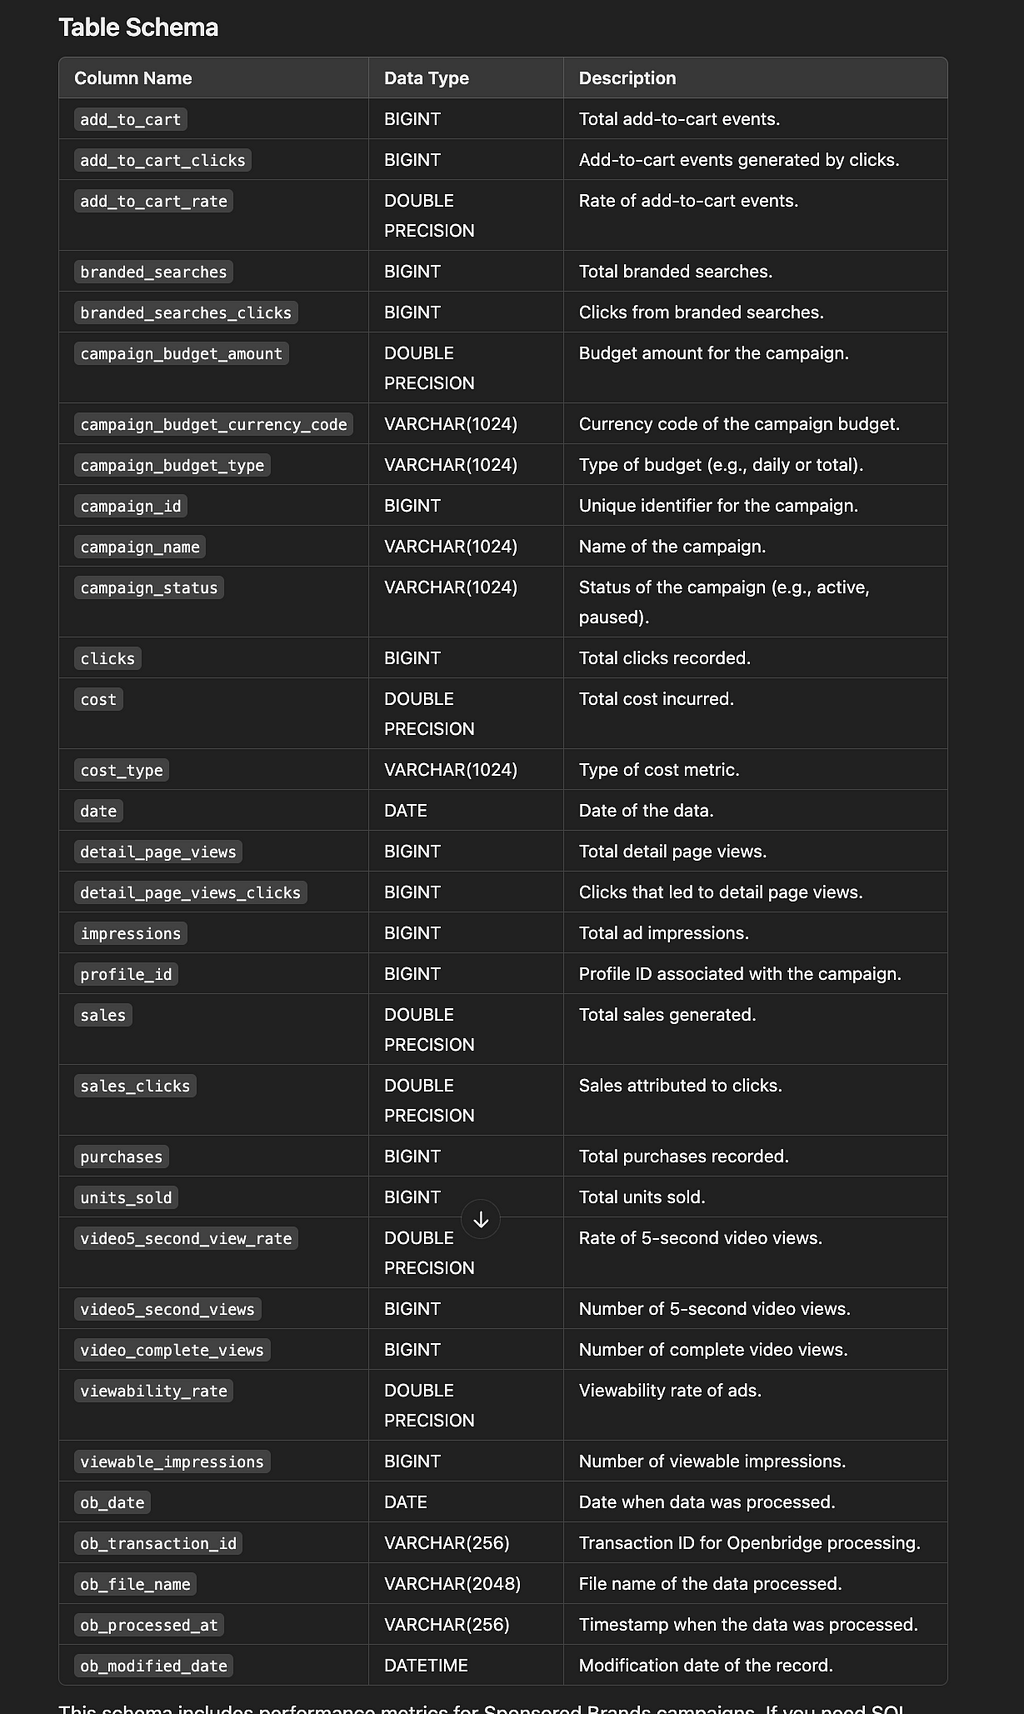
Using the Openbridge AI Data Copilot, the schema for this report follows:
Understanding the report’s insights helps you:
- Assess Campaign Effectiveness: Identify which campaigns are meeting objectives.
- Optimize Budget Allocation: Redirect funds to high-performing campaigns.
- Strategize Growth Opportunities: Spot areas for expansion and increased ROI.
- Branded Searches: Measures brand awareness by tracking how often customers search for your brand.
- New-to-Brand Metrics: Indicates the number of first-time purchasers, highlighting customer acquisition success.
- Sales: Total revenue generated from campaigns.
- Return on Ad Spend (ROAS): Evaluate the efficiency of your advertising spend.
Analyzing these metrics allows you to tailor strategies to different customer journey stages, from awareness to conversion.
Optimizing Campaigns Based on Report Insights
Here are suggestions for optimizing your Sponsored Brand campaigns based on the insights provided in the amzn_ads_sb_campaigns report:
Enhance Budget Allocation
- Action: Monitor campaign_budget_amount and campaign_budget_type to ensure campaigns with high conversion rates (sales/clicks) or click-through rates (view_click_through_rate) have a sufficient budget.
- Why: High-performing campaigns may require increased budgets to avoid missed opportunities due to budget constraints.
Improve Targeting Strategy
- Action: Use data on branded_searches and branded_searches_clicks to identify the effectiveness of brand-related keywords. Invest in high-converting branded terms. Exclude underperforming or irrelevant keywords (negative targeting).
- Why: Focus on targeting terms with the highest relevance and performance to maximize return on ad spend (ROAS).
Analyze Audience Behavior
- Action: Leverage new_to_brand_detail_page_views and new_to_brand_units_sold to evaluate the acquisition of new customers. Develop campaigns targeting segments that show high engagement or conversion potential.
- Why: Prioritizing new-to-brand customers can grow your customer base and ensure long-term profitability.
Optimize Ad Creative
- Action: Review video5_second_view_rate, video_complete_views, and viewability_rate for video campaigns. Test new creatives with higher engagement. Improve video length, content relevance, and call-to-action clarity to increase completion rates.
- Why: High-performing visuals and engaging videos enhance brand recall and drive action.
Refine Bidding Strategy
- Action: Analyze top_of_search_impression_share to evaluate visibility. Increase bids for high-performing campaigns or keywords with strong conversion rates. Lower bids for underperforming campaigns to improve cost efficiency.
- Why: Competitive bids improve placement in high-visibility areas like the top of search results, maximizing clicks and conversions.
Adjust for Seasonality
- Action: Use the date column to identify seasonality trends in performance metrics like impressions, clicks, and sales. Increase spend during peak periods for your category. Decrease spend during slower periods while maintaining brand visibility.
- Why: Aligning budgets and strategies with demand cycles ensures efficient use of advertising resources.
Monitor Campaign Status
- Action: Regularly review campaign_status for campaigns that may be paused or not delivering impressions. Address issues causing campaigns to pause (e.g., budget exhaustion, eligibility issues).
- Why: Active management ensures consistent campaign performance and avoids downtime.
Focus on Conversion Optimization
- Action: Track metrics like purchases, units_sold, and sales for campaigns and refine: Ad copy or offers to boost conversions. Landing pages to reduce friction and improve purchase likelihood.
- Why: Conversion-centric strategies improve overall campaign profitability and ROAS.
Manage Invalid Traffic
- Action: Use metrics like gross_impressions and invalid_impressions (from other related datasets) to identify and reduce invalid traffic.
- Why: Reducing invalid impressions and clicks protects ad spend and ensures a higher share of genuine customer engagement.
A/B Testing
- Action: Test variations in creatives, budgets, or targeting strategies and compare performance metrics (add_to_cart_rate, detail_page_views_clicks, new_to_brand_purchases_rate).
- Why: Continuous testing uncovers strategies that drive better performance over time.
Enhancing Data Analytics with Openbridge
Ditch the messy, manual reporting for the Amazon Advertising Sponsored Brand Campaign Report. Automated data feeds guide data-driven decision-making to improve off-Amazon digital marketing campaigns. Leverage attribution insights to refine strategies, allocate resources efficiently, and enhance customer engagement across all touchpoints.
Openbridge unifies and delivers performance data to leading data lakes and cloud warehouses, including:
- Amazon Redshift
- Google BigQuery
- Snowflake
- Azure Data Lake
- Amazon Athena
- Databricks
This creates an analytics-ready single source of truth, fueling informed decisions on brand strategy, media planning, and understanding customer demand on Amazon. Unified data from Openbridge can turbocharge reporting and analytics tools like:
- Looker Data Studio
- Tableau
- Microsoft Power BI
- Looker
- Amazon QuickSight
- SAP
- Alteryx
- dbt
- Azure Data Factory
- Qlik Sense
Integrating with these platforms can enhance customer engagement across all touchpoints.
Getting Started with Amazon Advertising Campaign Report Automation
Openbridge specializes in delivering unified, analytics-ready data solutions. By providing code-free, fully managed data pipelines, Openbridge helps businesses harness the full potential of their data without the complexities of manual processes.
Get a 30-day free trial to try Amazon Advertising Sponsored Brand Campaign Report automation!
Amazon Advertising Campaign Reports for Sponsored Brands was originally published in Openbridge on Medium, where people are continuing the conversation by highlighting and responding to this story.
from Openbridge - Medium https://ift.tt/Qb0iDTq
via Openbridge


Thursday, December 12, 2024

Wednesday, December 11, 2024

Tuesday, December 10, 2024


Subscribe to:
Posts (Atom)

